| Menu |
|
Pollach, G.; Berninger, H.:
Testing the currently valid ash coefficient for determination of conductivity ash in white sugar
by determination of the alkali and alkaline earth components using atomic absorption (German). Zuckerindustrie 105 (1980) pp. 992-994. List of papers |
| Abstract: Results of comparative tests on determination of the ash content of white sugar samples by conductivity measurement and atomic absorption spectroscopy are reported. For the latter method a process with matrix compensation with a mixed bed ion exchanger was used. This matrix compensation was also applicable for determination of volatile elements (Pb, Cd) in white sugar by graphite furnace techniques. |
| Table 1: AAS conditions |
| Element | K | Na | Ca | Mg |
| Flame | Acetylene air | |||
| Flame character | oxygenating | oxygenating | stoichiom. | oxygenating |
| Wavelength (nm) | 766.5 | 589 | 422.7 | 285.2 |
| Slit (μm) | 320 | 160 | 320 | 320 |
| Integration time (s) | 16 | 16 | 16 | 16 |
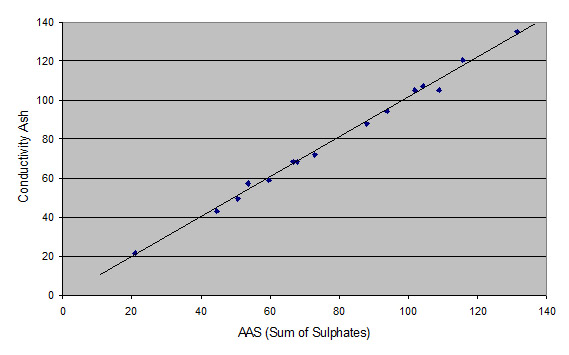
| Table 2: AAS results converted to sulphates and compared to conductivity ash |
| Sample | K | Na | Ca | Mg | Sum of Sulphates |
Conduct. ash |
Diff. | Diff. % on Sulphates |
| mg per kg of white sugar | ||||||||
| 1 | 32.4 | 8.7 | 0.84 | 0.45 | 104.3 | 107.1 | +2.8 | +2.6 |
| 2 | 34.3 | 7.3 | 0.75 | 0.09 | 101.9 | 105.3 | +3.4 | +3.3 |
| 3 | 16.9 | 1.2 | 0.90 | 0.06 | 44.6 | 43.2 | -1.4 | -3.1 |
| 4 | 19.5 | 1.7 | 0.25 | 0.17 | 50.6 | 49.5 | -1.1 | -2.2 |
| 5 | 40.8 | 5.0 | 0.54 | 0.21 | 109.0 | 105.3 | -3.7 | -3.4 |
| 6 | 27.3 | 6.6 | 3.46 | 0.18 | 93.7 | 94.3 | +0.6 | +0.6 |
| 7 | 41.0 | 8.7 | 3.77 | 0.11 | 131.6 | 135.3 | +3.7 | +2.8 |
| 8 | 44.3 | 4.9 | 0.39 | 0.12 | 115.7 | 120.7 | +5.0 | +4.3 |
| 9 | 22.4 | 6.8 | 0.46 | 0.09 | 72.8 | 72.1 | -0.7 | -1.0 |
| 10 | 6.7 | 1.3 | 0.31 | 0.20 | 21.0 | 21.5 | +0.5 | +2.4 |
| 11 | 20.9 | 1.7 | 0.15 | 0.26 | 53.6 | 57.3 | +3.7 | 6.9 |
| 12 | 19.7 | 5.9 | 1.61 | 0.03 | 67.8 | 68.7 | +0.9 | +1.3 |
| 13 | 19.3 | 1.7 | 3.37 | 0.03 | 59.6 | 59.1 | -0.5 | -0.8 |
| 14 | 13.4 | 2.6 | 14.11 | 0.40 | 87.9 | 87.9 | 0.0 | 0.0 |
| 15 | 19.2 | 6.0 | 1.5 | 0.03 | 66.6 | 68.7 | +2.1 | 3.2 |
| Mean difference | +1.0 | +1.1 | ||||||
 |
| Table 3: Comparison of AAS sulphates and cond. ash with different standards |
| Sample | Difference in mg of ash per kg of white sugar for the standard variant: | ||
| with sucrose addition (mixed bed ion exchange purification) | without any addition (aqueous standards) |
with HCl addition (final conc. 0.1 mol/L) | |
| 1 | +2.8 | +4.5 | +4.9 |
| 2 | +3.4 | +2.7 | +3.4 |
| 3 | -1.4 | -2.3 | -2.8 |
| 4 | -1.1 | -0.7 | -0.9 |
| 5 | -3.7 | -1.4 | -2.8 |
| 6 | +0.6 | +6.5 | +5.8 |
| 7 | +3.7 | +8.1 | +8.0 |
| 8 | +5.0 | +5.3 | +3.5 |
| 9 | -0.7 | +0.1 | -0.1 |
| 10 | +0.5 | +0.1 | -0.7 |
| 11 | +3.7 | +2.3 | +2.5 |
| 12 | +0.9 | +2.5 | +0.1 |
| 13 | -0.5 | +3.1 | +2.2 |
| 14 | 0.0 | +11.3 | +4.6 |
| 15 | +2.1 | +4.5 | +1.8 |
| Mean | +1.0 | +3.1 | +2.0 |
| s | 2.4 | 3.7 | 3.2 |
| Menu |